download file
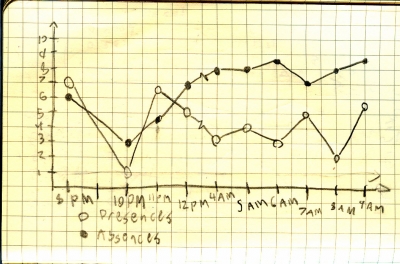
The second graph, which laid out my desire for presences (with open circles) versus absences (with closed circles). I forgot to make a notation at 9 PM, so that bits missing. Again, the zig-zag indicates the discontuity between 12 and 4 AM, where I was sleeping. Besides graph my desire, these figures show my ridiculous sleep schedule.

