Activites Graph.JPG

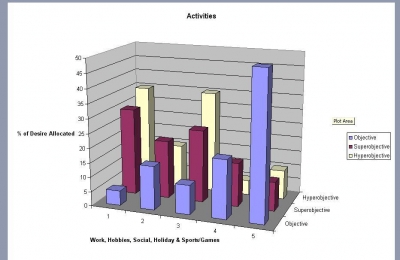
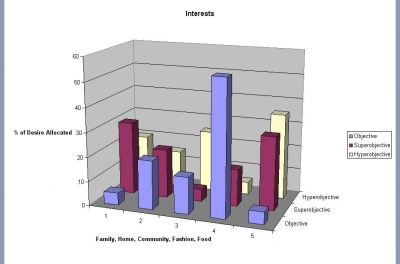
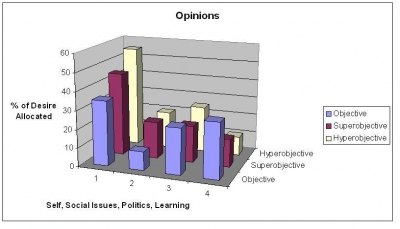
Ok, so for this task I went straight to my university education to try and come up with some fancy theory to back up my graph. My Marketing textbook for this year broke down target audiences by their psychographic variables, in other words, the things which make up their map of who they are and what's important to them in what proportions. These variables are grouped under what's called the AIO in marketing - Activities, Interests and Opinions. By Assessing how eager I was to participate and succeed in each of the variables within these three groups, my desires are plotted. To complexify this, I also included Stanislavsky's method acting theories of desire. That is, in any given scene, an actor must identify that his/her character will always have an objective, a superobjective and a hyperobjective for their actions. Characters desire on three very different levels - immediate desire, long term desire, and whole life retrospective desire. For example, right now I don't want any social contact, so #3 under Activities objective is low. However this month I don't want to be alone all the time, so superobjective under that category is more heavily weighted. And over my lifetime, I desire a lot of social interaction, so it's importance to me under hyperobjective is again weighted accordingly. This has been graphed in Excel for the three psychographic categories and the three temporal considerations, across a range of appropriate variables.
4 vote(s)
Terms
(none yet)2 comment(s)
Thanks for the welcome, It's an amazing game.


A transient fashion victim too...
Welcome to the game.