15 + 33 points
The Museum of Statistical Anomalies by Greta Heiss
April 7th, 2010 8:29 PM / Location: 43.130194,-77.60205
Beatlemania!
Using the root data here and the magic of Excel and Pivot Tables, I came up with the following:
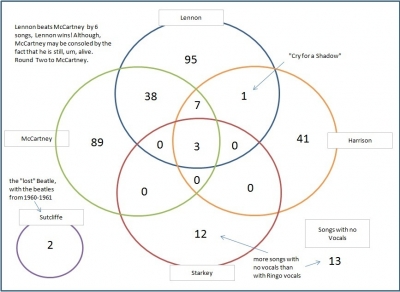
Ok so, in graph form we've got:

and the outlier? Ringo.

Anyone want to collaborate on the display?
Using the root data here and the magic of Excel and Pivot Tables, I came up with the following:
| Lead Singer(s) | Number of Songs |
| Lennon | 95 |
| McCartney | 89 |
| Harrison | 41 |
| Various Lennon McCartney Combos | 38 |
| No Vocals | 13 |
| Starkey | 12 |
| Lennon, McCartney and Harrison | 7 |
| Lennon, McCartney, Harrison and Starkey | 3 |
| Sutcliff | 2 |
| Lennon and Harrison | 1 |
Ok so, in graph form we've got:

and the outlier? Ringo.

Anyone want to collaborate on the display?
10 vote(s)
2


Fealix
3
Sombrero Guy
5
Optical Dave
5
Picø ҉ ØwO
3
teucer
3
Markov Walker
5
done
4
Spidere
2
Sir Pinkleton
1
Idøntity matrix
Terms
(none yet)4 comment(s)
posted by Greta Heiss on April 8th, 2010 11:06 AM
Thanks! Yeah... it was getting late and I got lazy. Sorry. I will strive to be less lazy in the future.
posted by Sombrero Guy on April 8th, 2010 3:40 AM
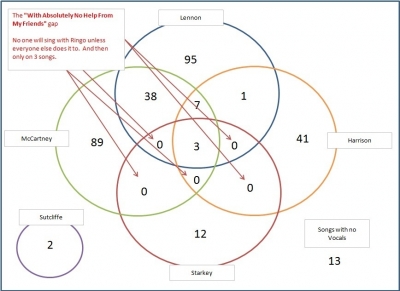
The "With Absolutely No Help From My Friends" gap made me laugh.
Great effort!


I approve of this diagram. for two reasons. one it looks really cool! two It is really well done. I kinda wish there was a funny story about it though.