


15 + 9 points
What Is The Internet? by Cunning Linguist
July 6th, 2006 3:49 PM
I'm not sure if this task was made in order to either make fun of Ted Stevens, bring the net neutrality issue to light or to actually get to the core of what the internet really is. If it's for the first two (or something akin), then I disagree with this task even being offered. But since I believe this task addresses a much more important and far-reaching subject than this (400 point) task, I'm going to treat this one a bit more seriously than (maybe) originally intended.
Preface
There are so many attributes by which to define the internet. The debate on these semantics can go on indefinitely. So, in an effort to minimize the possible arguments and counterarguments made available by this explanation, I'm just going to pick one attribute. The question: What is the internet? The answer: Large.
Seems intuitive enough. Well, I don't think this fact is very appreciable to many people. I don't think many people necessarily consider all the possibilities when they sit in front of a web-browser. Instead, they connect to their regularly scheduled programs (gmail, sf0, livejournal, nytimes, wikipedia etc.) without pausing to contemplate the true magnitude of what is at hand. And not that anybody should either, IMHO no one person (armed with just a web browser) could ever really grasp the magnitude of the internet.
Hopefully I can adequately share some thoughts people have had on the idea of how large the internet really is.
More than a 'Net'
I definitely think that the internet is much more than just a "global network of computers". That, to me, is like saying the human brain is just an organ. So much of what the internet has allowed us to do goes far beyond connecting computer A in Oregon with computer B in Switzerland. Among countless advances, the internet has allowed an unprecedented growthspur in world/local economy, technology, science, society, culture, education and entertainment. The level of information that the internet has made available to the general public has allowed for such tremendous strides in innovation, but what makes this level of information different than other mediums is two things: immediacy and volume. At any given moment (armed with an internet connection of course) anyone can compile enough data on any one topic to fill several hours/days worth of material to go through. This opened up channels previously unavailable to the public that allowed for such remarkable development.
Visualizations
On the whole, humans are very visual creatures. Our most refined sense is that of vision. No other sense matches it in resolution. Visualizations allow our minds to build metaphors for more abstract ideas. Properly constructing a visualization of a given set of information can elucidate qualities not easily seen 'at-a-glance'.
Visualizations have in fact become such a staple of human communication, that data visualization and vision culture have a very deep rooted role in scientific analysis (see Information Visualization and Visualization and Computer Graphics for related peer reviewed journals). From simple histograms to multivariable nonlinear calculus, the idea of taking large, complicated data and presenting it in digestible chunks seems to be a tried and true method of conveying perplexing ideas to others.
The following images and descriptions attempt to give a small glimpse at the supposed 'nature of the beast'.
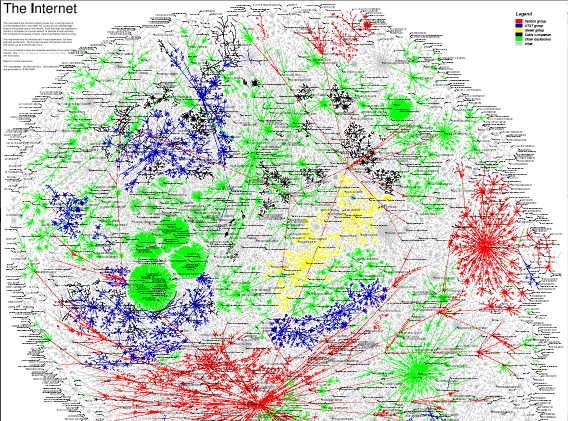
This is an extremely detailed map of the North American Internet backbone including 134,855 routers. the colors represent who each router is registered to: red is Verizon, blue AT&T, yellow Qwest, green is major backbone players like Level 3 & Sprint Nextel, black is the entire cable industry put together, & gray is everyone else, from small telecommunications companies to large international players who only have a small presence in the U.S.
this map demonstrates that although AT&T & Verizon own a lot of Internet pipes, they currently do not dominate the Internet infrastructure (yet). Full sized completely zoomable pdf (1.1megs) can be found here.
And even more maps and varied analyses can be found here.
In response to lumeta's internet mapping project (above) - the following is a free still ongoing project that attempts to map the Internet on a weekly basis, analyzing wasted IP space, IP space distribution, & detecting the result of natural disasters, weather, war, & aesthetics/art. inspired by the visual results from internet mapping, a faster & open-source approach was developed that is capable of generating complete Internet map in 20 seconds on a simple notebook.
Attached is also an mpg of a zoom into a graph with a quick display of local IPs. More maps can be found here.

What's even more remarkable is that in order to give these maps some discernible structure, only a single (typically most common) path/connection between nodes is chosen (as opposed to the hundreds, thousands or possibly millions of paths that one can take to a server) so that in the end there is more of a visible tree/leaf structure to it all. Within these leaves, or even nodes, there exist completely different yet complex and dynamic networks. The following demonstrates a popular examples (out of innumerable ones) and the REAL (not virtual) inferences made from these visualization (regarding communities and connections).
The flickrland visualizations are several different information visualizations depicting the collection of flickr authors & their link network. In the flickrland universe (depicted below) several clusters are visible, for instance the large group of participants from the United Arab Emirates.
The large flickr poster.
Network analysis of the Flickr population, based on data collected on March 14th, 2005.

Preface
There are so many attributes by which to define the internet. The debate on these semantics can go on indefinitely. So, in an effort to minimize the possible arguments and counterarguments made available by this explanation, I'm just going to pick one attribute. The question: What is the internet? The answer: Large.
Seems intuitive enough. Well, I don't think this fact is very appreciable to many people. I don't think many people necessarily consider all the possibilities when they sit in front of a web-browser. Instead, they connect to their regularly scheduled programs (gmail, sf0, livejournal, nytimes, wikipedia etc.) without pausing to contemplate the true magnitude of what is at hand. And not that anybody should either, IMHO no one person (armed with just a web browser) could ever really grasp the magnitude of the internet.
Hopefully I can adequately share some thoughts people have had on the idea of how large the internet really is.
More than a 'Net'
I definitely think that the internet is much more than just a "global network of computers". That, to me, is like saying the human brain is just an organ. So much of what the internet has allowed us to do goes far beyond connecting computer A in Oregon with computer B in Switzerland. Among countless advances, the internet has allowed an unprecedented growthspur in world/local economy, technology, science, society, culture, education and entertainment. The level of information that the internet has made available to the general public has allowed for such tremendous strides in innovation, but what makes this level of information different than other mediums is two things: immediacy and volume. At any given moment (armed with an internet connection of course) anyone can compile enough data on any one topic to fill several hours/days worth of material to go through. This opened up channels previously unavailable to the public that allowed for such remarkable development.
Visualizations
On the whole, humans are very visual creatures. Our most refined sense is that of vision. No other sense matches it in resolution. Visualizations allow our minds to build metaphors for more abstract ideas. Properly constructing a visualization of a given set of information can elucidate qualities not easily seen 'at-a-glance'.
Visualizations have in fact become such a staple of human communication, that data visualization and vision culture have a very deep rooted role in scientific analysis (see Information Visualization and Visualization and Computer Graphics for related peer reviewed journals). From simple histograms to multivariable nonlinear calculus, the idea of taking large, complicated data and presenting it in digestible chunks seems to be a tried and true method of conveying perplexing ideas to others.
The following images and descriptions attempt to give a small glimpse at the supposed 'nature of the beast'.
This is an extremely detailed map of the North American Internet backbone including 134,855 routers. the colors represent who each router is registered to: red is Verizon, blue AT&T, yellow Qwest, green is major backbone players like Level 3 & Sprint Nextel, black is the entire cable industry put together, & gray is everyone else, from small telecommunications companies to large international players who only have a small presence in the U.S.
this map demonstrates that although AT&T & Verizon own a lot of Internet pipes, they currently do not dominate the Internet infrastructure (yet). Full sized completely zoomable pdf (1.1megs) can be found here.
And even more maps and varied analyses can be found here.
In response to lumeta's internet mapping project (above) - the following is a free still ongoing project that attempts to map the Internet on a weekly basis, analyzing wasted IP space, IP space distribution, & detecting the result of natural disasters, weather, war, & aesthetics/art. inspired by the visual results from internet mapping, a faster & open-source approach was developed that is capable of generating complete Internet map in 20 seconds on a simple notebook.
Attached is also an mpg of a zoom into a graph with a quick display of local IPs. More maps can be found here.
What's even more remarkable is that in order to give these maps some discernible structure, only a single (typically most common) path/connection between nodes is chosen (as opposed to the hundreds, thousands or possibly millions of paths that one can take to a server) so that in the end there is more of a visible tree/leaf structure to it all. Within these leaves, or even nodes, there exist completely different yet complex and dynamic networks. The following demonstrates a popular examples (out of innumerable ones) and the REAL (not virtual) inferences made from these visualization (regarding communities and connections).
The flickrland visualizations are several different information visualizations depicting the collection of flickr authors & their link network. In the flickrland universe (depicted below) several clusters are visible, for instance the large group of participants from the United Arab Emirates.
The large flickr poster.
Network analysis of the Flickr population, based on data collected on March 14th, 2005.


I can vote for this now, cause you've already taken my #5 slot.
I am so petty...