

Graph of Desire by Secret Cello
January 18th, 2008 8:51 AMSo, this spun back to the question: who did I really want? Obviously, the solution was in charts and graphs. So I've drawn the following graph for lots of people, for current girlfriends, for ex-es, for pillowtalk, for friends. It's ridiculous, but it contains a little kernel of truth*.
* = (p < .05)
It's also changed over time as I've drawn it on bar napkins and index cards, so here's my best recollection of how it evolved:
The initial graph, circa age 20.

Intellectualness on one side (which really means, how awesome and thought-provoking are our conversations), and shared activities on the other.
The scales are logarithmic: 0 represents complete hate, 2 neutrality, and 10 complete awesomeness.
Post college, and post my first big relationship fizzling out, I dated a lot. In the words of Dan Savage, I "discovered that there were three billion people of the opposite gender out there", and so my pickiness went up.

I also learned this lesson, which probably you had already figured I was leaving out:

I moved to New York 4 years ago, and added this shortly there after:

Today, the graph looks like so:

First, I found out that as much as the numbers crunched out right, all activities and no thought made for a dull dull time. It's interesting that I'm still considering the "sacrifice everything you do for someone with whom with you have great conversations."
I also found out that I like kids like I like dogs: they are absolutely fantastic for your best friends to have. (The star means: open-to-adoption-maybe-kinda-sorta-check-back-in-five-years)
Does it represent all the nuances of who I like and what people tend to like me? Not really, but even after DEEP THOUGHTS on the matter, I still realize that when I look over profiles, this little graph just keeps on evaluating in my head and spitting out results: "Message Now! Pass! Save for later!"
PS: +1 point for red hair
datingcard1.jpg
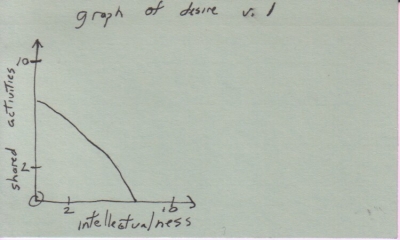
First version: almost linear, x^1.5 + y^1.5 = 12 roughly Solutions: (7,0), (4.5,4.5), (0.7)
datingcard2.jpg
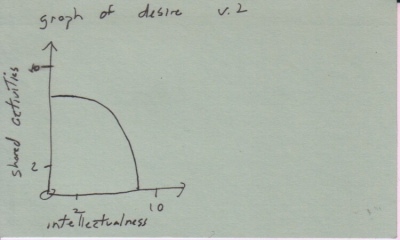
Second version: graph is now curved, something like: x^3 + y^3 >= 512 Solutions (approximate): (8,0), (6.5,6.5), (0,8)
datingcard3.jpg
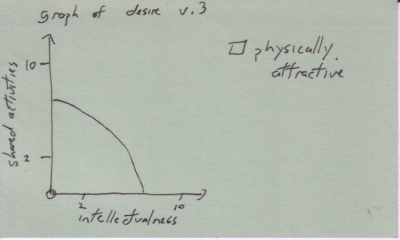
Same curve, but now realizing that attraction matters. Shocking! Solutions: (8,0) , (6.5,6.5) , (0,8)
datingcard4.jpg
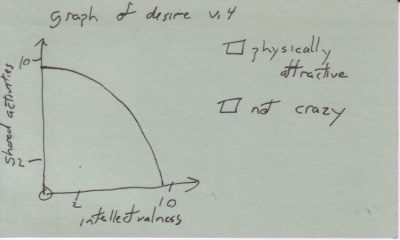
Quality demanded has gone up, as well as how inelastic the graph is at high values. Solutions: (9.5,0), (8,8), (0,9.5)
datingcard5.jpg
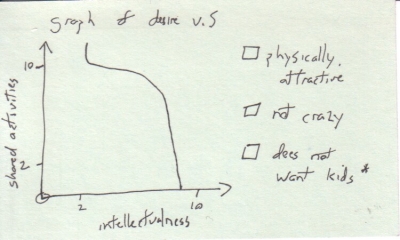
Now, we asymptote before reaching the X axis, and intellectualness grows in importance. Solutions: (3,10), (8,8), (9,0)
13 vote(s)

Lizard Boy
5
NHØ Bananapants
5
GYØ Ben
5
Spidere
5
JJason Recognition
5
Too Much Exposition
5
susy derkins
5
rongo rongo
5
Levitating Potato
5
Flitworth
5
Not Here No More
5
Markov Walker
5
Polutropos Rathazaxx
Favorite of:
Terms
(none yet)12 comment(s)
Yeah, that's the idea. Of course, for most people, you don't really know exactly where they fall (especially before a first date), so you just take your best guess, your margin of error, and hope for the best.
I like how long you've been keeping the graphing going.
I would have thought it would have evolved a lot more over the years. But I guess you know what you want.
A friend of mine has a powerpoint lecture on what he calls the high-throughput method of dating.
spidere: Isoquants! I had thought of these as indifference curves, mainly because it's my demand curve, not the production (!) of women.
susy: The idea is that each increasing number is exponentially more unlikely: somebody who's a 10 is just someone who that our intellectual minds are just perfectly matched. To put it another way, I've never met a 10 on either scale. For a long time, I believed that meeting a 10 even with complete antipathy on the other scale, would be enough, so those people would have to be very rare.
I once met a ten on both scales and it blew my mind. I had no idea how to comprehend it. I had no idea how to proceed. It kinda sucks, because when you find that ten, they also find you a ten (I think it cannot work any other way), and two people with such mind blowing new experiences to deal with find it hard to function properly.
We studied the problem of selecting a mate in Discrete Mathematics. Suppose a dating pool of size n, and you wish to maximize your chances of selecting the best member of that pool. Further suppose that the order you review candidates is effectively random, and that you can't change your mind after making a decision.
From those constraints, there is in fact an optimal strategy. As our professor put it, he used said strategy, and it worked for him, and his wife didn't, and so it didn't work for her...
Ha! I know that strategy too: rank order them as they come in, ignore the first 1/e percent (roughly 37%), and then take the first one after who is your best so far.
This is probably not good dating advice, although lots of people take a far looser version, which is that there is a strong urge (and societal pressure), to settle down at a certain age, and a lot of that pressure is because the assumption that the dating pool dries up around the early 30s (which I think is kind of a wrong assumption, but whatever).
However, this formula is fantastic for finding apartments. Take an n which is the number of apartments you think you have the tolerance to look at (say 15). Look at then n/e (~5) of them without any chance of renting to get a feel for the market, and then take the first one after that that's the best.
So, a n of 130 for the intersection of not crazy, physically attractive and does not want kids?
+1 point for red hair, in either direction?
This is so adorkable
Yes. That is totally what I meant. :) Sorry about that.
I lose.


I'm assuming that curve is "anyone to the right of this is dateable"?