


.jpg "TEAM: Probot")


Statistically Speaking by Darkaardvark
May 14th, 2008 2:40 PMYou don't need to understand or even enjoy math to appreciate this task, however. I'll clearly mark where the math (more specifically, statistics, as is appropriate to the task) begins and ends. Feel free to skip it.
One day I began to become concerned over the sloth with which many students seemed to descend a staircase at my school. This was simply unacceptable. Were they really dawdling, though, or was it just my imagination? What could solve this mystery? Surely only statistical testing would do. So I set out to measure, over the course of many mornings, the time it took students to descend the staircase when it was otherwise empty. This would ensure that they weren't being held up by traffic. The testing is as follows.
Math (statistics) begins here
Warning: I have only a rudimentary understanding of statistics, probably comparable to an introductory-level class or thereabouts. While I have done my best to ensure that tests were carried out properly, I make no guarantees. Also, I can't make any fancy math symbols here so words will have to do.
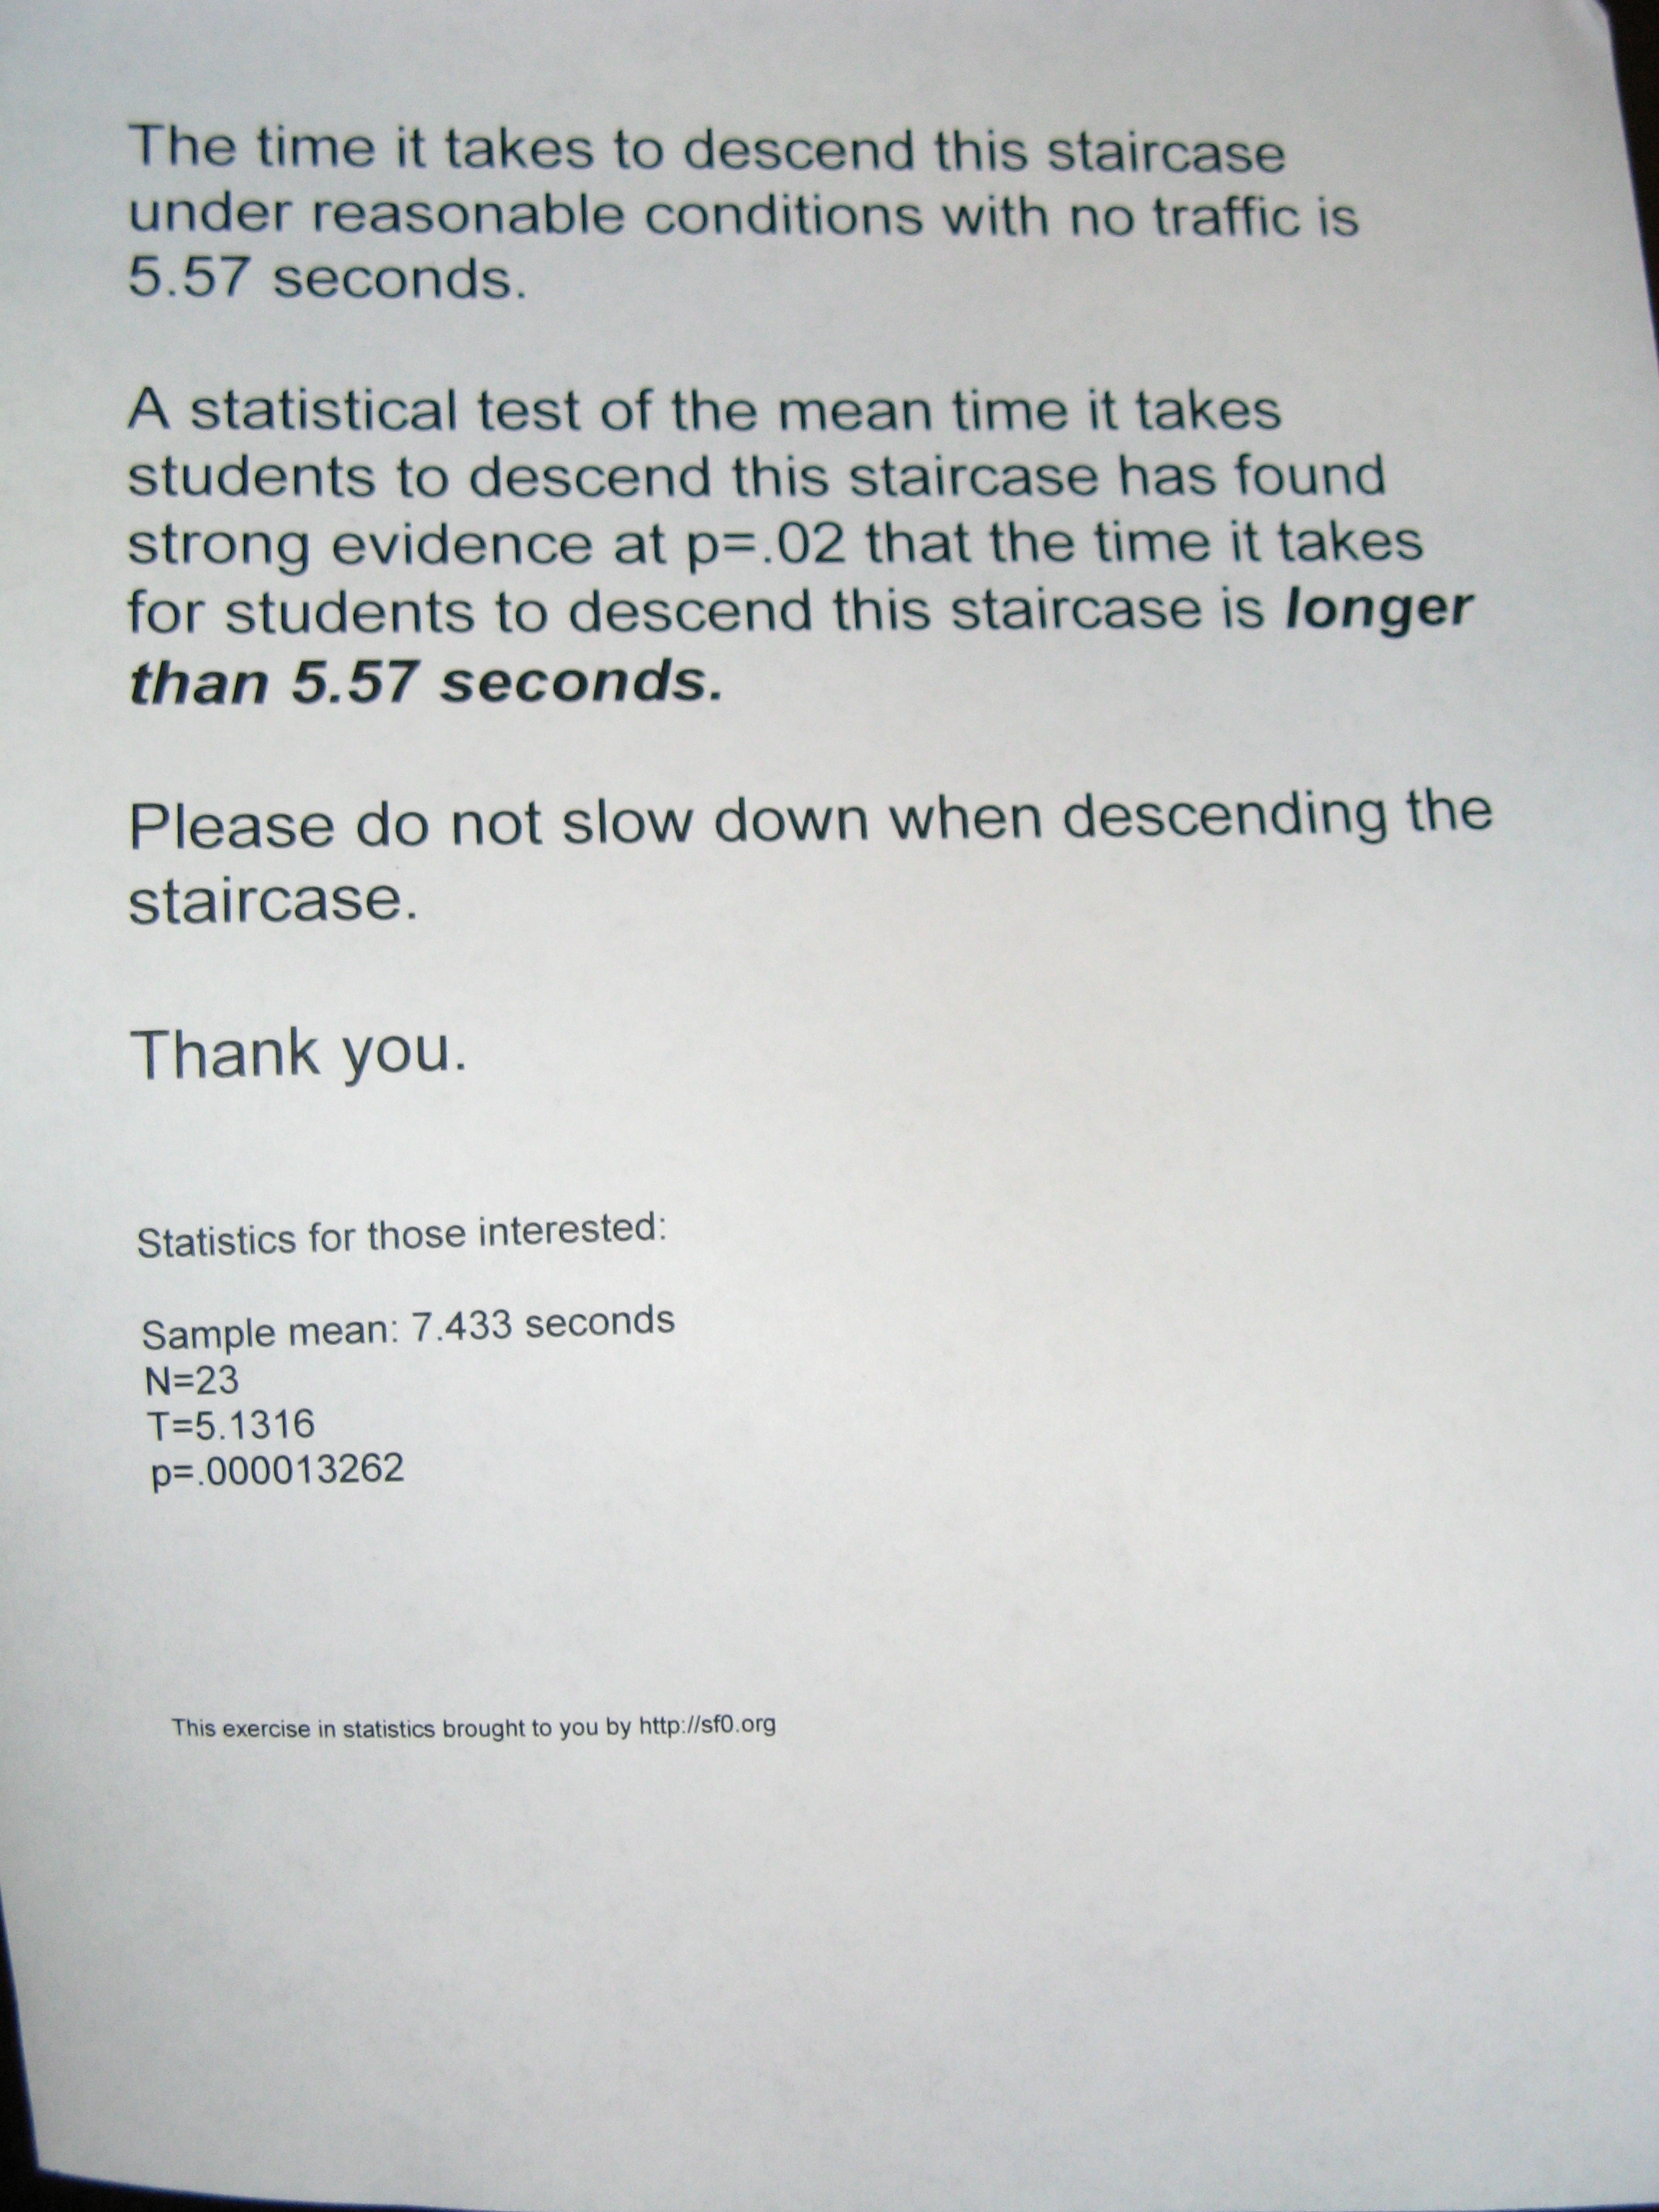
I. We want to compare the mean time for students descending the staircase to the mean time it takes to descend the staircase at a reasonably quick pace without any interfering traffic. This was measured as 5.57 seconds.
Null hypothesis: Mean(descent time for students) = Mean(quick descent)
Alternative hypothesis: Mean(descent time for students) > Mean(quick descent)
II. Our data are from a stratified random sample- data were measured alternating from male and female subjects. Because data measurement was sporadic, this is essentially a convenience sample, however, as all subjects were descending the staircase without other traffic, and no bias was given as to who was measured, our survey should be reasonably random enough to test on.
n=26 and while a larger sample size would be preferably, a normal plot of our data shows a roughly normal distribution with only a slight negative skew.

As there is no information on our actual population mean or SD, we will use a one-tailed T-test. As we are reluctant to accuse the student body of sloth without ample evidence, we will set alpha at .02.
III. null mean = 5.57
sample mean= 7.443
n=26
Standard deviation of sample = 1.8615
T=5.1316
p= .000013262
IV. Our p-value is near zero and is definitely < p=.02 Thus, we reject the null hypothesis and find that our data suggests significant evidence towards the alternative hypothesis. The mean time for descending the stair case appears to be greater than that of the time for a rapid descent.
Extremely brief summary of a comparison between male/female descent times:
The average mean descent time for males was compared to that of females. A two-sample two-tailed t-test between the sample means was conducted. A p-value of .3216 was returned. We fail to reject the null hypothesis and find no evidence that male times differ significantly from female times.
Math ends here
So what did we just find? Quite simply, that students are lazy bastards. They are taking far too long to descend the staircase and possibly innocent bystanders are being caught behind them, unable to descend the staircase at the speed at which they would prefer. We must inform them of this travesty.
However, we also found that the times for males and females descending the stairs were not significantly different. This is a great victory for gender equality! The student body should be lauded for their achievement.
A sign was created to inform them of the results.
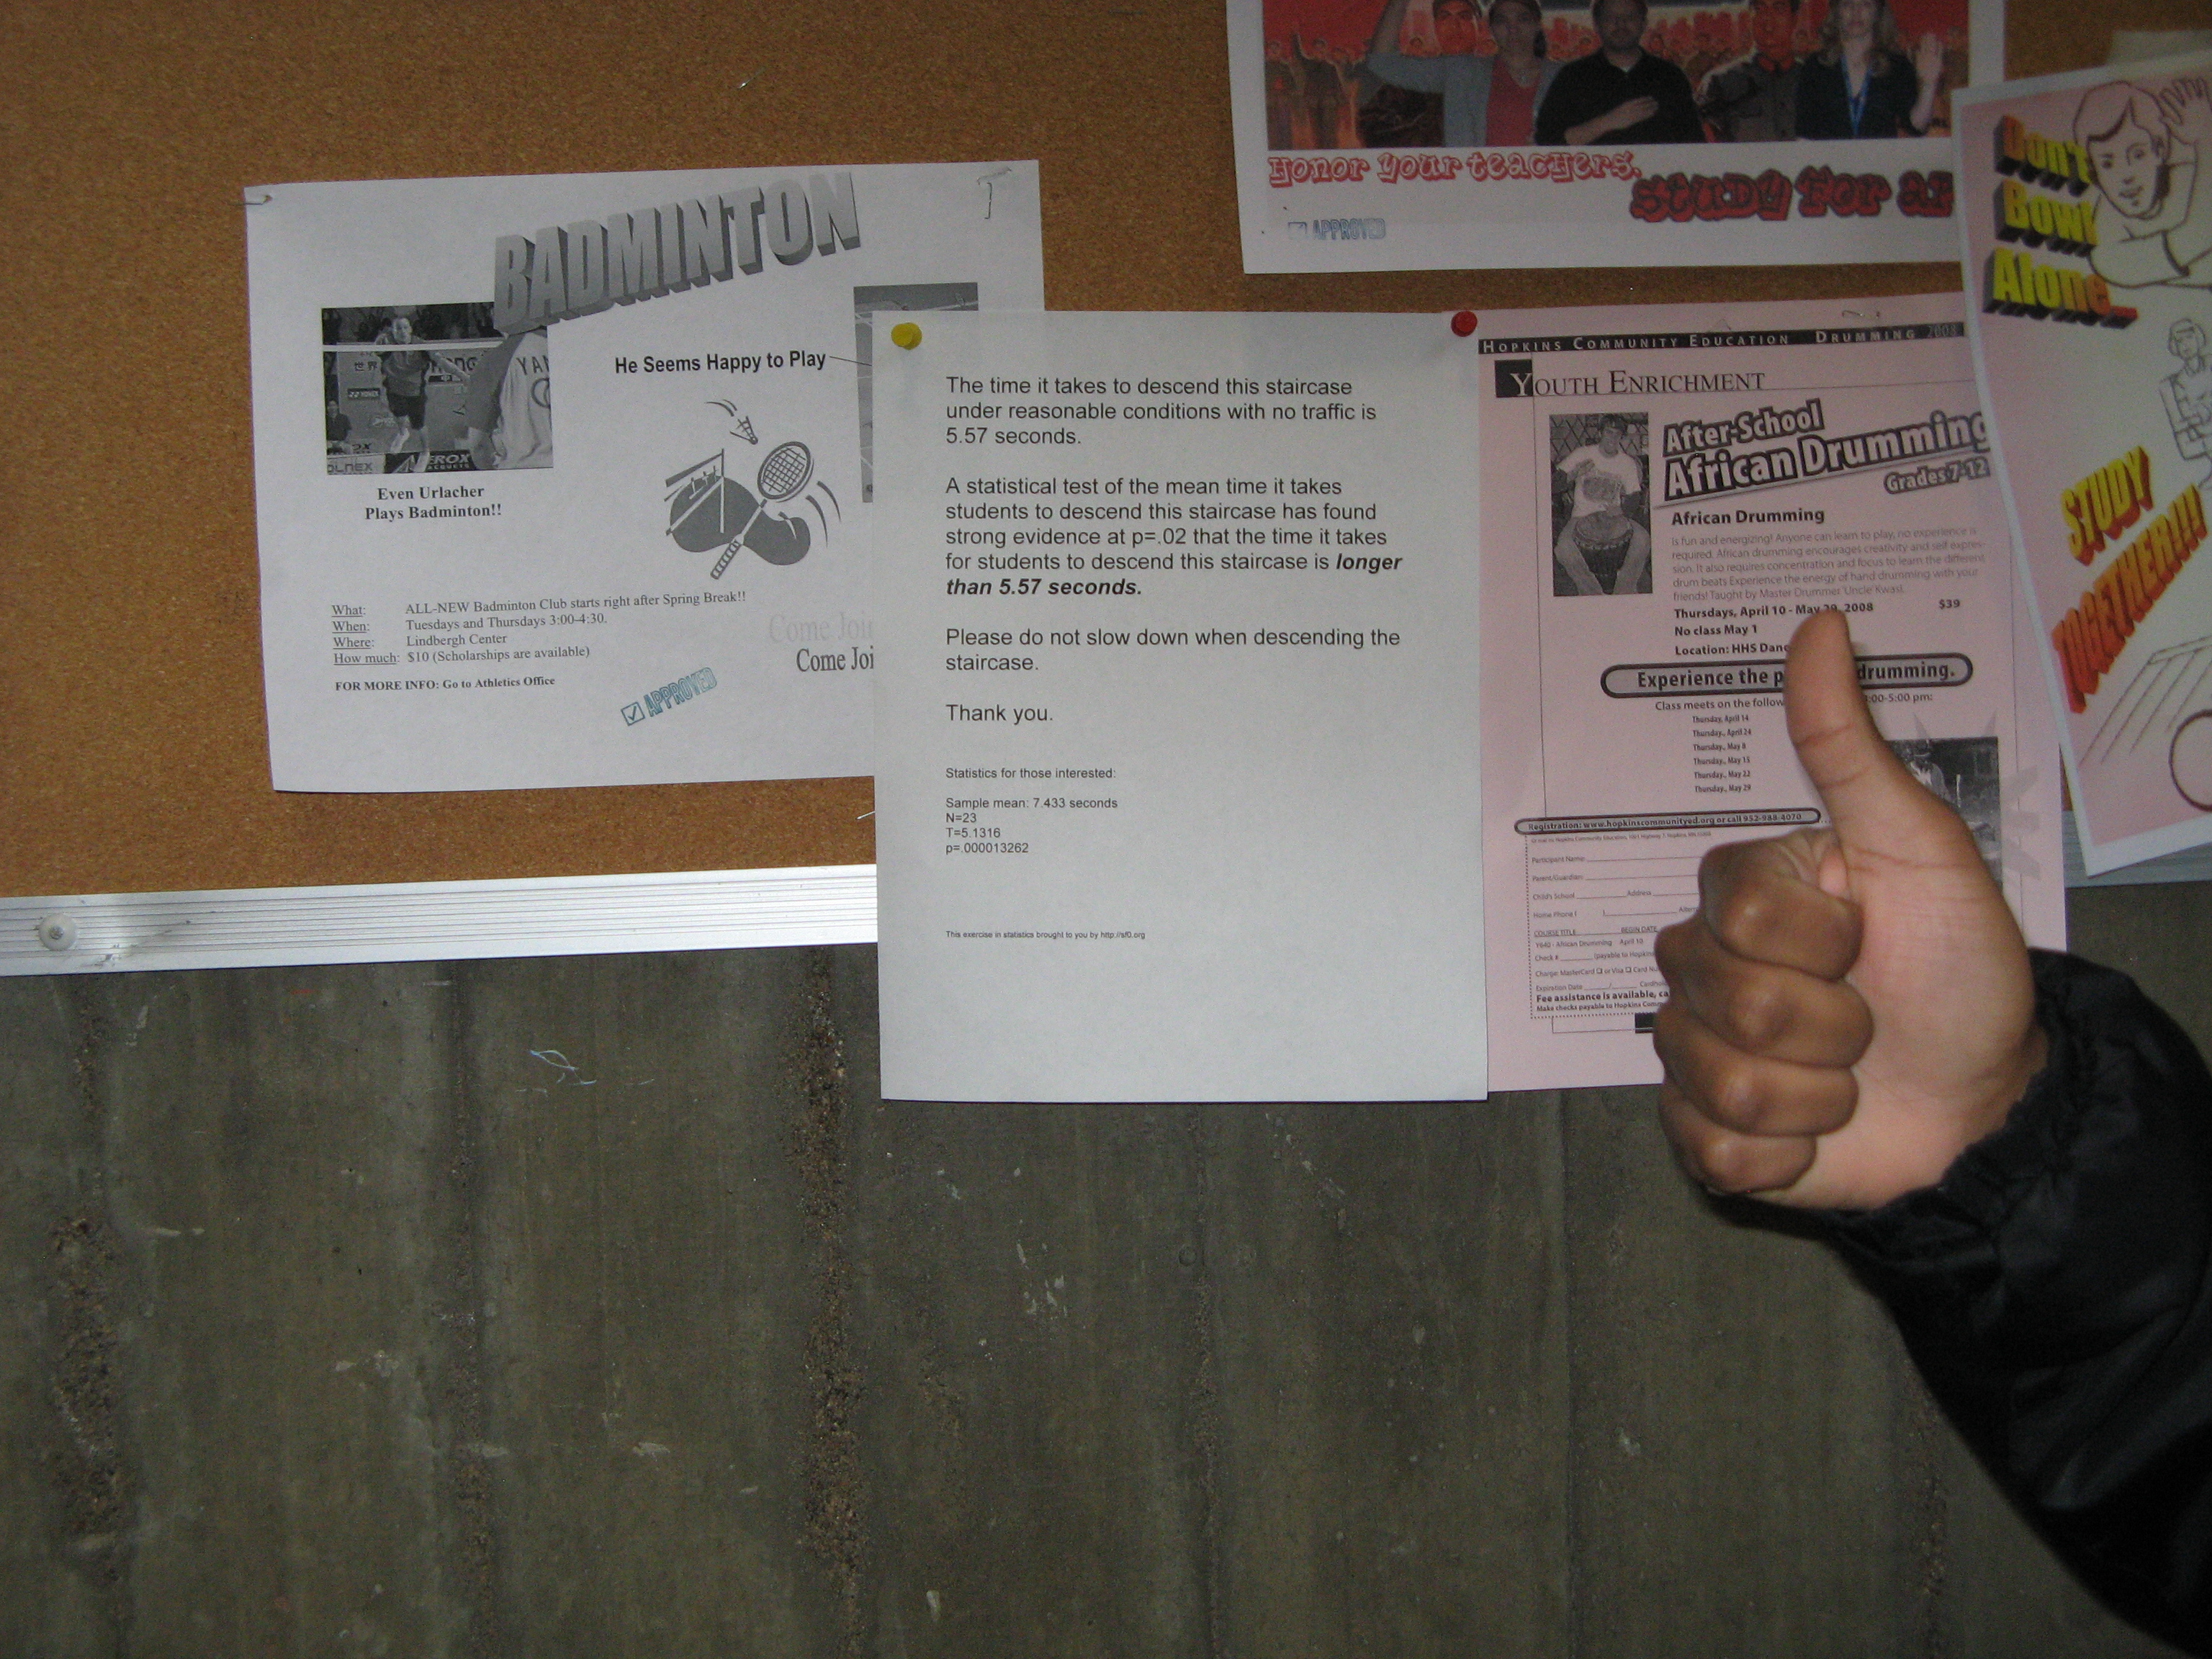
It was then posted, under the watchful eyes of several security cameras, at the bottom of the staircase, where it would be visible to everyone descending said staircase.
Success! Statistically speaking, of course.
Edit: Fixed a < sign.
Normal plot of the data
Ah, TI-83+, you are a trustworthy friend (except when you crash and wipe your RAM in the middle of an important exam)
The Sign
I sort of regret not signing it "Thank you, the MGMT"
Posted!

Which was a pain, given the number of security cameras and tight restrictions on what can be posted. It's the on second from lower-left
Rao Approves!
Thumbs up from sf0 comrades, likely no thumbs up from the administration.
19 vote(s)

Sparrows Fall
5
Tøm
5
Evil Sugar
5
Burn Unit
5
teucer
5
Haberley Mead
5
help im a bear
5
JK Bobbins
5
Optical Dave
5
Peter Shoaf
5
teh Lolbrarian
5
Lincøln
5
Julian Muffinbot
5
done
5
The Animus
5
Dela Dejavoo
5
Adam
5
Loki
5
Andy Loves You!
Terms
(none yet)11 comment(s)

The sign reads like an information plaque at a science museum, which is awesome.
If I came across this, It'd make my day!

Wait, why is your n = 26 in the text and = 23 on the sign?

Erm, good question. I'll check on that when I get a chance, but it's probably just a typo on one of the two.

vote boycott for implying that statistics is not math >:|
edit for clarity--i am refering to the following UNACCEPTABLE statement: "I'll clearly mark where the math (well, it's actually more statistics, as is appropriate to the task) begins and ends."
The offending statement has been edited for clarity- I figured the big "THIS IS A MATH PROOF" heading would get the idea across, but I'm fine with clarifying it. I'm not implying that statistics is not mathematics, but rather that it is a specific branch of mathematics.

Where is your sign posted? Top of the stairs or bottom? Do you accept the suggestion that posting said sign may in fact slow down the average time it takes to either ascend or descend the staircase, as it may cause an obstruction to the flow of bodies or a distraction to the course at hand?
I propose you also calculate the rate of movement since the sign's post, and with no signs to distract.
The sign is posted at the bottom of the stairs. There is ample space at the bottom of the stairs to stop and look at the sign while allowing traffic to continue flowing. I had assumed that people who noticed the sign would walk over to the board, thus removing themselves from the flow of traffic, but you could indeed be correct.
If the sign is not removed, I will take a follow-up survey and compare it to the original to see if anything has changed.

The bottom of the stairs is a good place to be. Grandma is protected there.

Yay statistics!