Information Insertion by Markov Walker
August 2nd, 2010 10:12 PM--Charles Simonyi
I have created a place with an absence of information and offer YOU, dear reader, the ability to insert information.
Try it for yourself. I'll be here to explain what you just did when you get back.
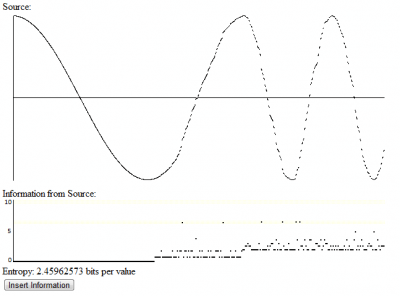
So you probably started by watching a sine wave slowly draw itself across your web browser. Sorry it took so long. Once it draws out one full period it should move quite a bit faster. I could probably use a trick or two to get rid of that initial slowdown, but I'm lazy. That sine wave is handily labeled "Source".
Below it you might notice a graph that says "Information from Source". That graph lines up vertically with Source to show you how many bits of information each value shown in source gives you upon observation. If you haven't inserted any information yet, the graph will be all the way at the bottom, at 0 bits. Below it you can see Entropy, which tells you how many bits of information, on average, you are getting from each value you are currently observing.
If you click the Insert Information button, you will see Source get a little more random. Information from source will go up and fluctuate with the randomness of the Source. Entropy will also increase. You can click again to add more and more information.
So why does inserting information cause Source to become more random? The information being measured is Shannon Information. In the late 40s and early 50s, Claude Shannon introduced Information Theory. One of the problems he worked on was an efficient way to code messages. An optimal encoding takes advantage of the naturally occurring asymmetries in the frequencies and patterns in the messages you want to send. You can give more typical messages smaller codewords and more atypical messages bigger codewords. If you have a probability distribution P over your message space, then the optimal length for any message m is at least -log(P(m)).
The units of information depend on the base of the logarithm. A base 10 log measures information in digits. Base 2 measures information in bits, and base e (the natural logarithm) measures information in a purely abstract unit called nats.
Since Shannon's introduction multiple actual coding strategies are able to get arbitrarily close to that theoretical lower bound, even when that lower bound is not a whole number, by putting multiple messages together and encoding them as one. Perhaps the most clever is called Arithmetic encoding.
In the above application, the message is the next value from Source. Before inserting information, the next value is perfectly predictable: it is whatever comes next in the sine wave. When an outcome is deterministically predictable, it takes 0 bits to describe. Its probability is 1, and log(1) = 0. You get zero bits of information by observing a perfectly predicted outcome.
The entropy H of a distribution X is the expected information per draw.

This quantity was named entropy for it's similarity to thermodynamic entropy.
So as you insert information, the typical value of the Information from Source graph increases steadily and the entropy goes up. It starts at the zero entropy, perfectly predictable distribution where at each time you get the next piece of the sine wave. Adding information makes the next piece distributed according to a Poisson(0.5) distribution, then Poisson(2), Poisson(5), Poisson(10), and Poisson(30). Finally, it goes to a uniform distribution, where every value provides a constant 7.7something bits of information (you can use that number to calculate how many pieces I cut my sine wave into).
19 vote(s)

Pixie
5
Professor Møbius
5
Lincøln
5
Ty Ødin
5
relet 裁判長
5
gh◌st ᵰⱥ₥ing
5
Dela Dejavoo
5
Julian Muffinbot
5
LittleMonk
5
carry_me_Zaddy
5
transit monkey
5
Joe
5
A M
5
Sir Pinkleton
5
Dan |ØwO|
5
Loki
5
Picø ҉ ØwO
5
[øwo] lady minirex
5
Idøntity matrix
Favorite of:
Terms
meta, math, randomness, statistics, programming6 comment(s)
This is actually one of the first task ideas I ever had for this game. It took some time to actually get it done.
Incidentally, the source also has the Markov property. Each new point is conditioned only on the previous point.
Heh, nice. I was just going to ask if you actually modulated a secret message as signal onto the wave.
You are a man with wondrous numerical sympathies
This proof has been flagged by 20 of your fellow players (for the benefit of all, flags are anonymous). As such, it has been automatically disapproved. Most likely, they've posted comments explaining why they're displeased. If you think you may be the victim of a bug, injustice, or a gang of Rubins, hit up the contact page.
If you think you can fix this proof, click 'edit this completed task', then 'Un-Submit Proof' (at the bottom of the editing page). Make your changes, hit Submit again, and the flags on this proof will be cleared.


Thats five points to vote on