Graph of Desire by JJason Recognition
January 14th, 2008 6:06 PMI made three graphs over the course of two days, charting the changes in my desires over time. In each case I checked my desires every hour, on the hour, and rated my desire on a scale from one to ten. Then I marked down my rating and connected the current point to the past points. I recorded these findings in moleskin notebook.
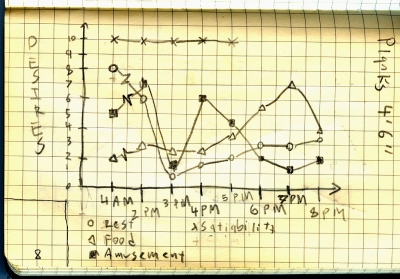
The first graph mapped out my hourly desires in terms of desire for rest, food, and amusement. Here I ran into the problem that I lacked a clear notion of what exactly each number meant. How hungry is, let's say, a 5 desire for food. I fear that I wasn't very consistent in these ratings, so the data graphed may not be terribly accurate. This initial graph took me from 4 AM on the 13th to 8 PM the same day (obviously I did not graph while I was sleeping. That would be difficult).
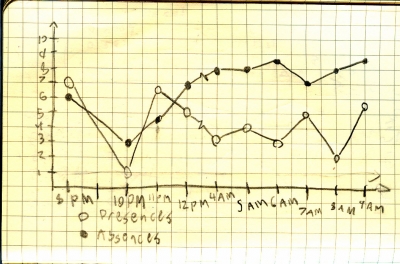
The second graph mapped out my desires in terms of presence and absence. Every hour, on the hour, I would stop and judge to what extent I desired things to cease (for example a ceasation of hunger, of cold, of consciousness) and to what extent I desired things to come into existence (for example the coming into existence of a waffle or internet connection). I rated these on a scale of one to ten and marked them down the the graph. This graph took me from 8 PM on the 13th to 9 AM on the 14th.
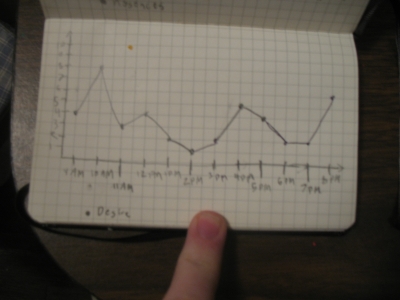
Finally, I whittled it down to one variable and graphed only my desire. Each hour, on the hour, I rated on a scale from one to ten the extent to which I was content versus the extent to which I was actively desiring something. This graph took me from 9 AM to 8 PM on the 14th, at which point I put an end to my desire graphing activities.
Findings: I was surprised by how difficult this was. It was difficult to rate my desires in from one to ten, even when I simplified dramatically. It was also difficult to figure out exactly what I desired, for the creation of variables to track and to figure out exactly what I was desiring at any given moment. I'm not exactly sure how accurate my results are.
Another thing I noticed is that I experience moments of surprising satisfaction (is not satiation) from time to time, but these moments are not particularly different nor am I dramatically less active during these moments. I'm not sure what this means. I guess that I don't have a clear grip on my desires, and in learning that this task was fruitful.
graph1.jpg

This is the first graph of my desires, indicating my desire for rest (circles), food (triangles), and amusement (squares.) The squiggly line indicates a discontinuity, in this case the ten hours I spent asleep.
graph2.jpg

The second graph, which laid out my desire for presences (with open circles) versus absences (with closed circles). I forgot to make a notation at 9 PM, so that bits missing. Again, the zig-zag indicates the discontuity between 12 and 4 AM, where I was sleeping. Besides graph my desire, these figures show my ridiculous sleep schedule.
Graph 3

The final graph. Unfortunately I wasn't able to get a scan of this one, but the basic movement over time should be clear. This graph maps out the movement of my level of desire, on a scale from one to 10.


